
AI Citation Network
Nearly two million AI publications from 2020 to 2025, scored by who actually gets cited and mapped by who writes with whom — the story of my master thesis.
By 2025, every government with geopolitical ambitions has a national AI strategy — but where is the research that underwrites those ambitions actually done, and whose work does the field build on? My master thesis assembles 1,986,659 AI-related publications from 2020–2025 via OpenAlex and measures research impact through fractional citation sums, comparing the three blocs that dominate the field — China, the USA, and the EU-27 — against everyone else taken together. Its centrepiece, shown below: the co-authorship network of the 1,000 most-cited institutions in AI research.
Research Questions
- How large a share of global AI citations does each of the three blocs — China, the USA, and the EU-27 — actually command?
- Which institutions carry that impact, and who writes papers with whom?
- Does the collaboration network follow geopolitical alignment, or something else entirely?
Why citations?
AI capacity could be measured in many ways — compute, capital, talent, benchmarks, patents. Almost all of them are hard to collect and harder to compare across countries. Scientific publications are the exception: research is both a catalyst and a proxy for a country's technological capability, and thanks to standardized international publishing it is measurable at scale. The thesis draws on OpenAlex, which indexes roughly four times as many works as Scopus or Web of Science and shows a far smaller geographic skew — essential when the question is precisely how impact is distributed between regions. The corpus was retrieved not with a naive search for 'artificial intelligence' but through a curated keyword pipeline expanded via survey papers, yielding 1,986,659 publications from 2020 to 2025. Impact is then scored with fractional citation sums: a paper's citations are split evenly across its authors' countries, so an internationally co-authored breakthrough is not credited in full to each of the six nations that touched it.
Three blocs, and everyone else
The question of who leads AI research is, in practice, a question about three actors. China, the USA, and the EU-27 together account for 58.9% of all AI publications and 63.5% of all citations; the entire rest of the world — every other country combined — is the residual. China leads outright with 24.1% of global AI citations, ahead of the EU-27 at 20.8% and the USA at 18.6%. That ordering is worth pausing on: on the measure the field itself uses to mark which work matters, the country most often described as catching up is already in front, and the gap between the three is narrow enough that a single strong year could reshuffle it. What the shares cannot tell us is whether these blocs form one research community or three — for that, the citations have to be traced to the institutions that earned them.
A map of a thousand institutions
Country totals hide where research actually happens, so the analysis descends to the institutional level: the 1,000 institutions with the largest fractional citation sums, connected by the intensity of their co-authorships and laid out with ForceAtlas2. Node size is the citation sum; only edges amounting to at least one fully balanced joint publication are drawn. The topology is telling. The EU-27 contributes the most nodes (282), spread across a broad, decentralized western half of the graph. The US cluster (161 nodes) converges with it in the north — Stanford, Harvard, and MIT all lean toward Europe, with British and Swiss institutions (Oxford, UCL, Cambridge, DeepMind, ETH Zurich) brokering the transatlantic corridor. China's 213 nodes form a dense, domestically integrated cluster that occupies less space than the smaller US cluster, insulated from Europe by a belt of 'rest of world' institutions. And the way Monash, Seoul National, and Tokyo sit right up against the Chinese cluster suggests that geography, trade, and diaspora shape scientific collaboration more than geopolitical alignment does.
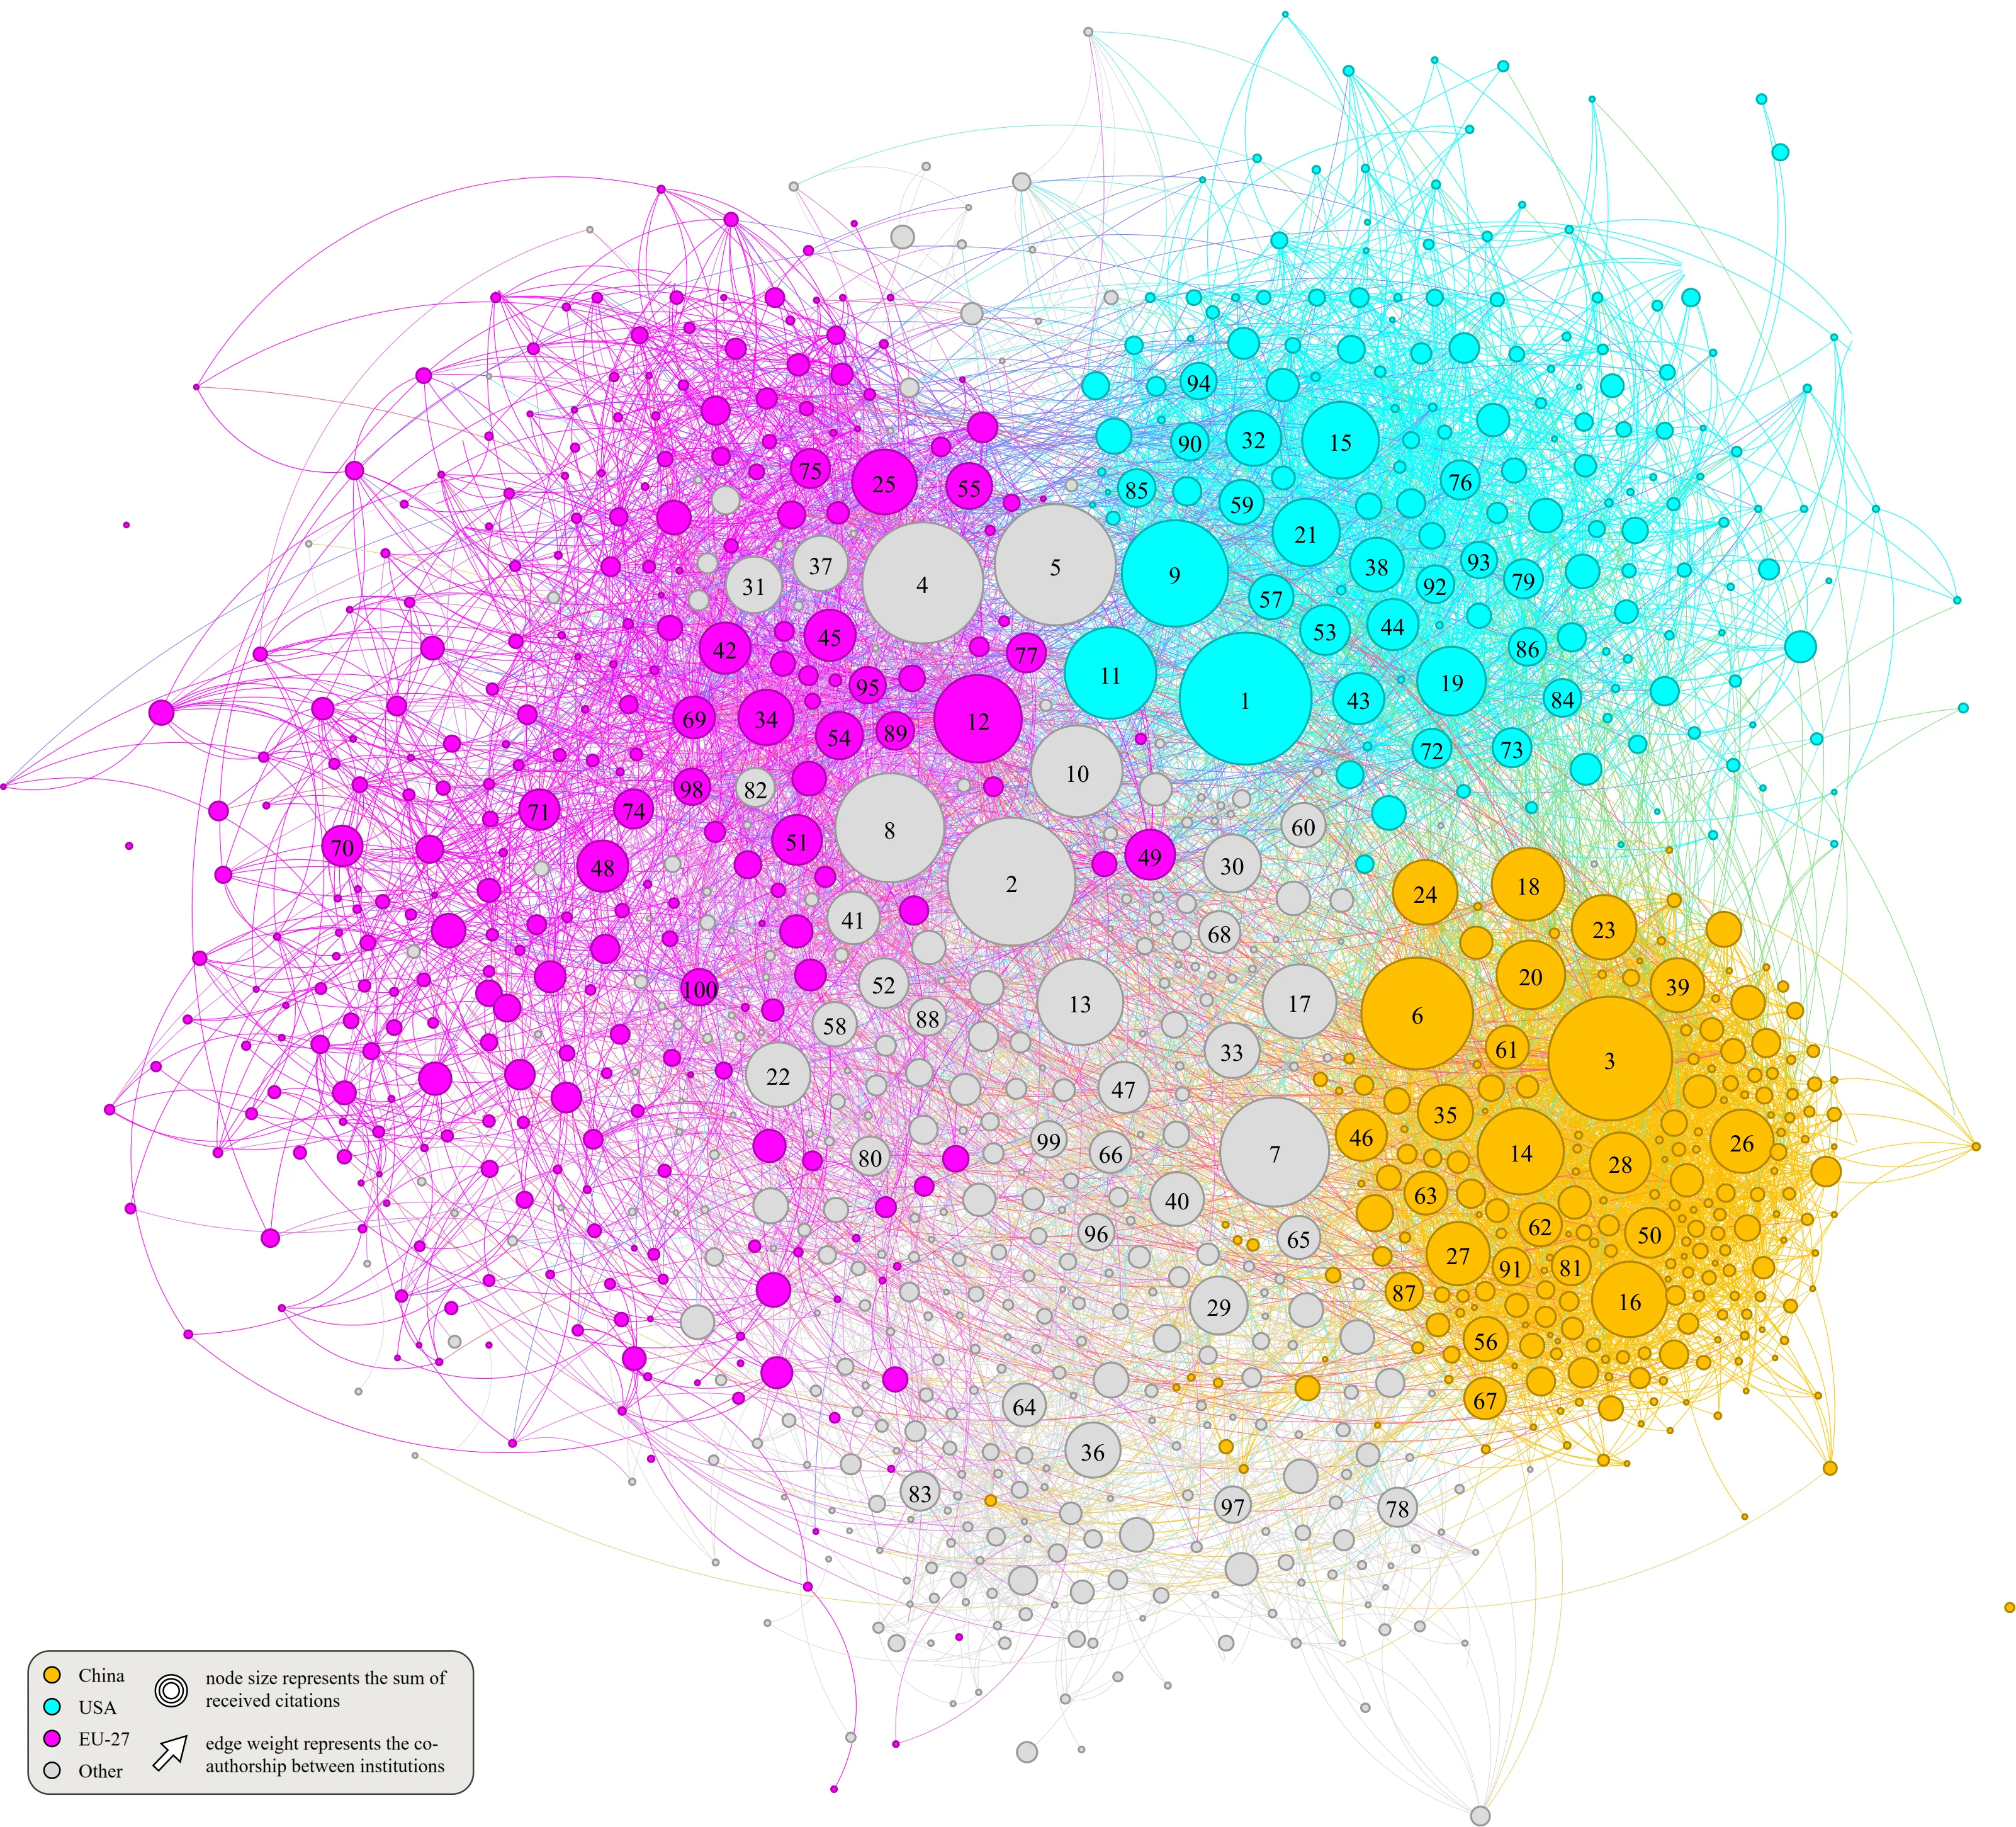
The 100 most-cited institutions
The numbered nodes resolve to the list below. Ninety-six of the hundred are universities; the only private research lab is DeepMind, and three entries — the Chinese Academy of Sciences, the CNRS, and the Broad Institute — are research organizations rather than teaching institutions, a reminder that corporate AI research largely stays out of the academic record. The rest of the world supplies 33 of the top 100 (eleven of them British, six Australian), the US 24, China 23, and the EU-27 20 — with the Netherlands alone providing seven of the EU's ten most-cited entries.
- 1 Stanford University
- 2 University of Oxford
- 3 Chinese Academy of Sciences
- 4 ETH Zurich
- 5 DeepMind
- 6 Tsinghua University
- 7 Monash University
- 8 University College London
- 9 Harvard University
- 10 University of Cambridge
- 11 Massachusetts Institute of Technology
- 12 Delft University of Technology
- 13 Imperial College London
- 14 Zhejiang University
- 15 University of Washington
- 16 Central South University
- 17 National University of Singapore
- 18 Wuhan University
- 19 University of Michigan
- 20 Shanghai Jiao Tong University
- 21 University of California, Berkeley
- 22 Norwegian University of Science and Technology
- 23 Peking University
- 24 University of Hong Kong
- 25 Technical University of Munich
- 26 Huazhong University of Science and Technology
- 27 University of Electronic Science and Technology of China
- 28 Sun Yat-sen University
- 29 Qatar University
- 30 University of Toronto
- 31 École Polytechnique Fédérale de Lausanne
- 32 University of California, San Francisco
- 33 Nanyang Technological University
- 34 KU Leuven
- 35 Tongji University
- 36 King Abdulaziz University
- 37 University of Zurich
- 38 University of Pennsylvania
- 39 University of Chinese Academy of Sciences
- 40 UNSW Sydney
- 41 King's College London
- 42 Utrecht University
- 43 University of California, San Diego
- 44 University of California, Los Angeles
- 45 Wageningen University & Research
- 46 Hong Kong Polytechnic University
- 47 The University of Melbourne
- 48 Politecnico di Milano
- 49 Technical University of Denmark
- 50 Sichuan University
Ranked by fractional citation sum across the 2020–2025 corpus; colors match the blocs in the network above.